univ_long <- univ_wide %>%
mutate(
hbcu_multiple = hbcu_enrollment / 222613,
non_hbcu_multiple = non_hbcu_enrollment / 10789524
) %>%
select(year, hbcu_multiple, non_hbcu_multiple) %>%
pivot_longer(
hbcu_multiple:non_hbcu_multiple,
names_to = "type",
values_to = "value"
)
non_hbcu_color <- "#ffb86c"
hbcu_color <- "#bd93f9"
ggplot(univ_long, aes(year, value, group = type, color = type)) +
geom_line(size = 1) +
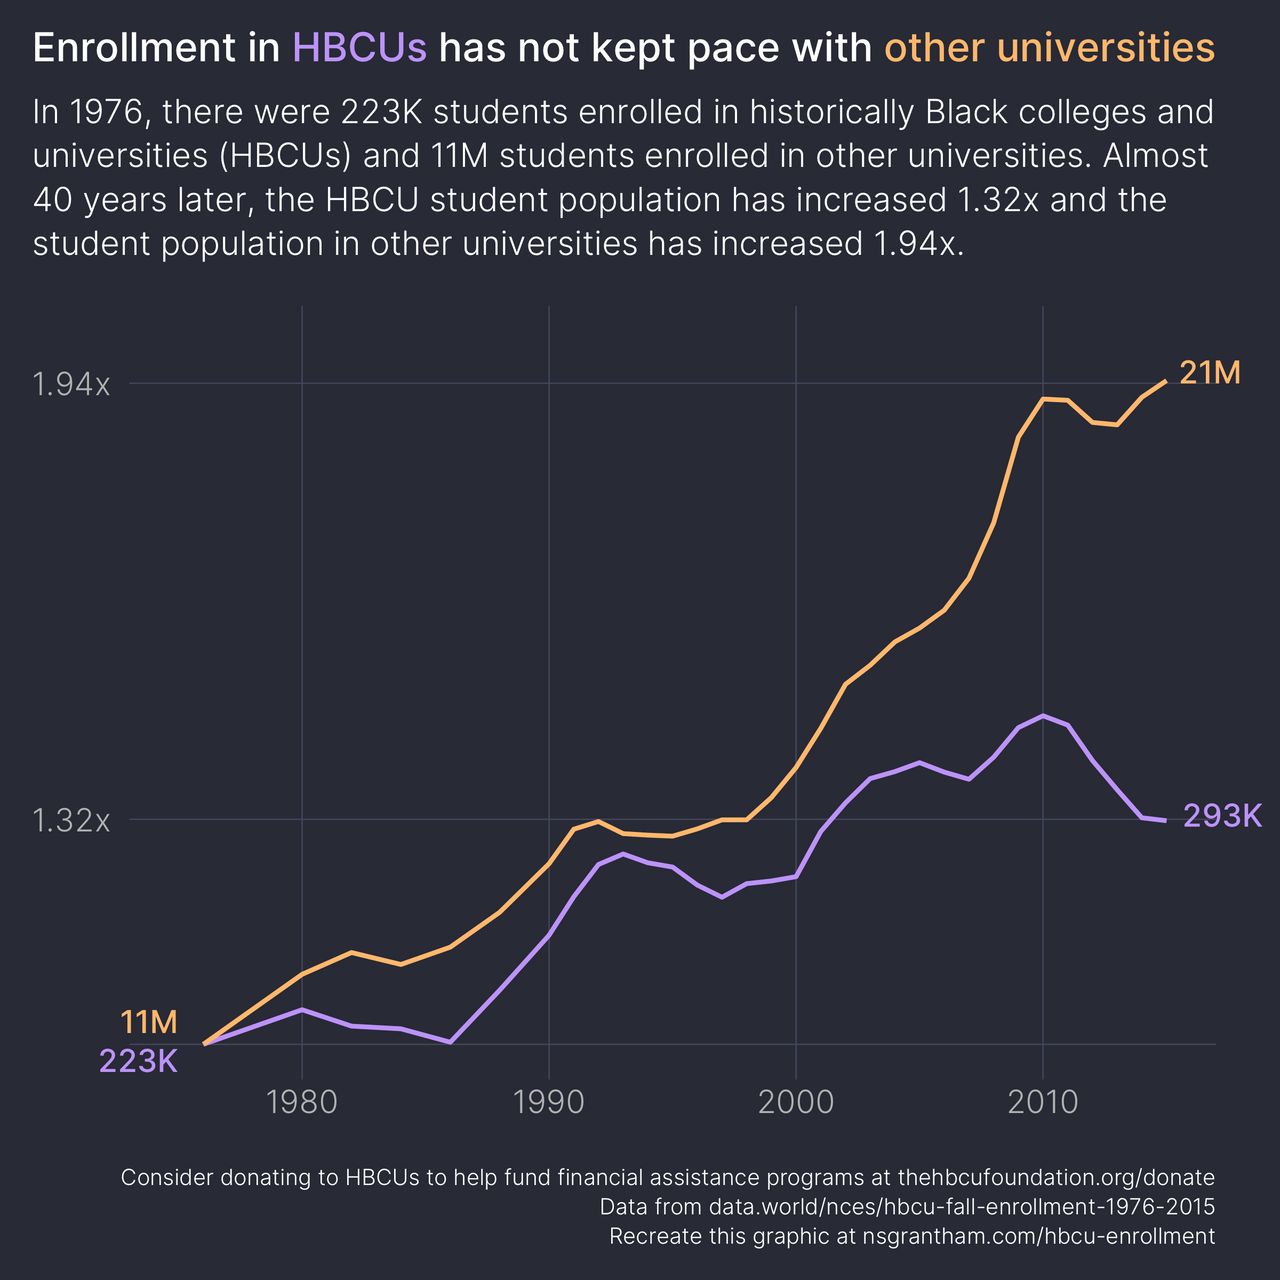
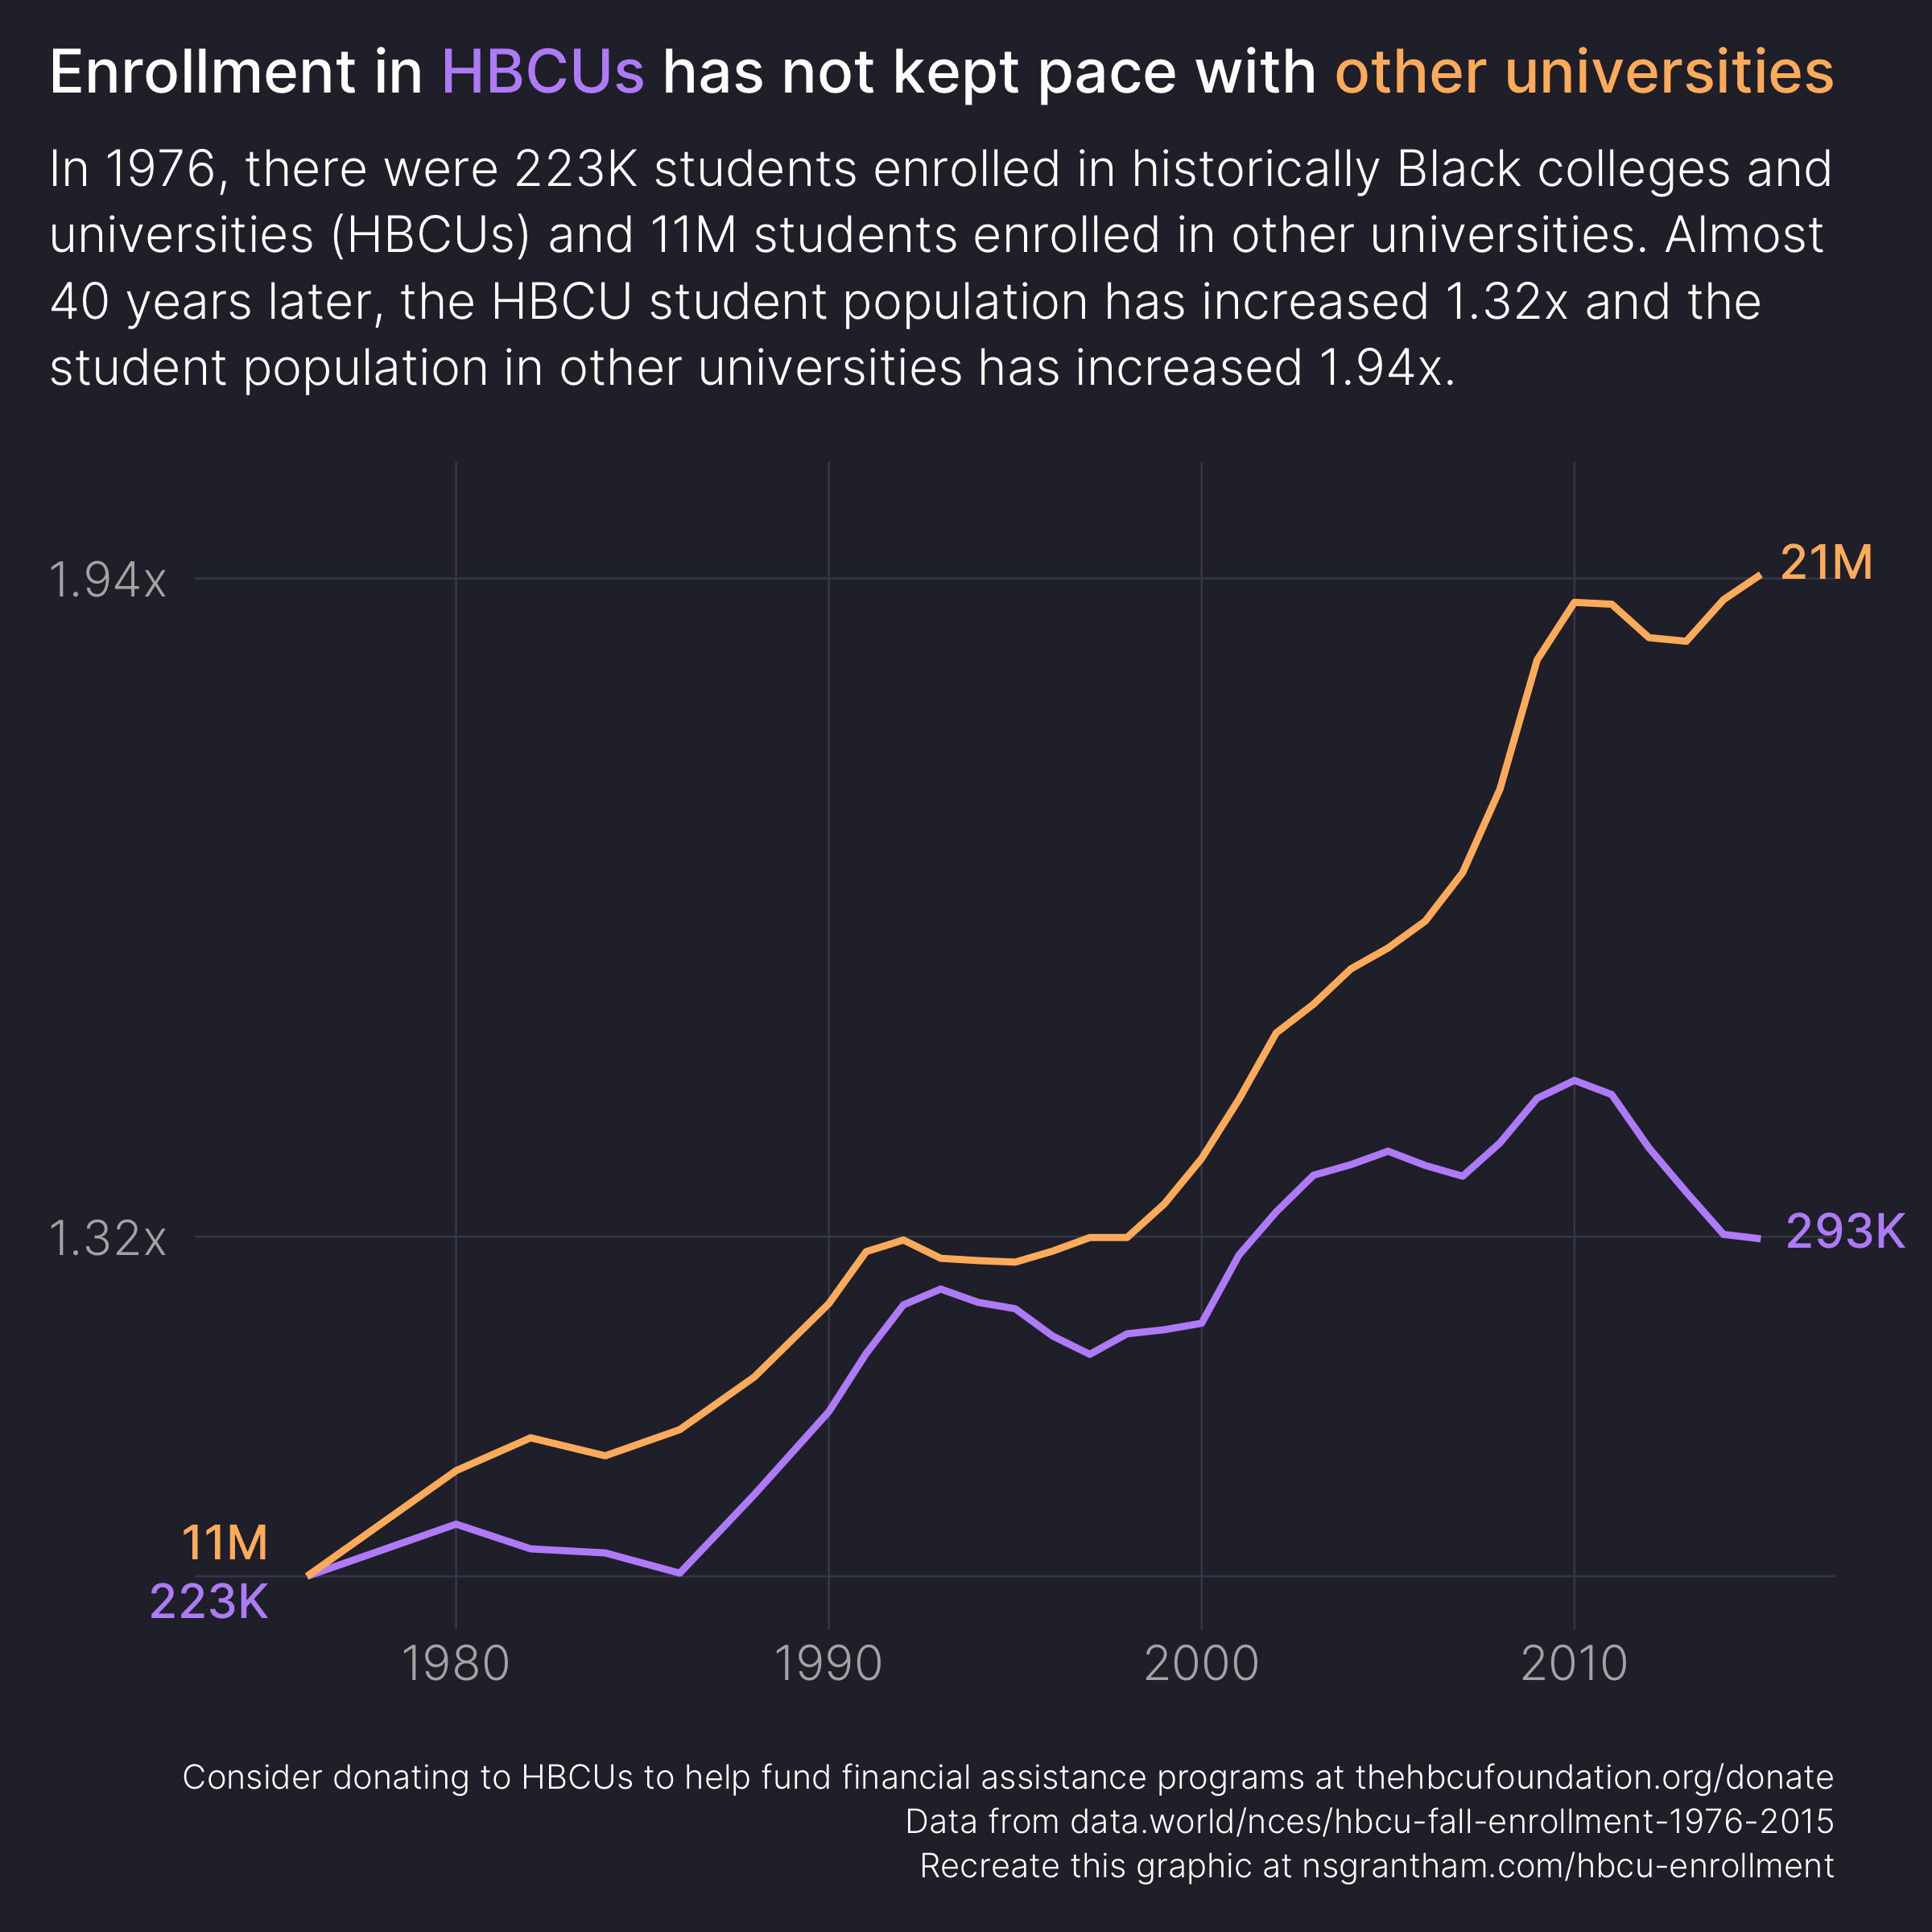
annotate("text", x = 1975, y = 1.00, hjust = 1.0, vjust = -0.5, label = "11M", size = 5, family = "Inter-Medium", color = non_hbcu_color) +
annotate("text", x = 1975, y = 1.00, hjust = 1.0, vjust = 1.2, label = "223K", size = 5, family = "Inter-Medium", color = hbcu_color) +
annotate("text", x = 2015, y = 1.94, hjust = -0.2, vjust = 0.0, label = "21M", size = 5, family = "Inter-Medium", color = non_hbcu_color) +
annotate("text", x = 2015, y = 1.31, hjust = -0.2, vjust = 0.0, label = "293K", size = 5, family = "Inter-Medium", color = hbcu_color) +
coord_cartesian(clip = "off") +
scale_color_manual(values = c(hbcu_color, non_hbcu_color)) +
scale_y_continuous(breaks = c(1, 1.32, 1.94), limits = 1:2, labels = c("", "1.32x", "1.94x")) +
labs(
title = glue::glue("Enrollment in <span style='color:{hbcu_color};font-family:\"Inter-Medium\";'>HBCUs</span> has not kept pace with <span style='color:{non_hbcu_color};font-family:\"Inter-Medium\";'>other universities</span>"),
subtitle = "In 1976, there were 223K students enrolled in historically Black colleges and\nuniversities (HBCUs) and 11M students enrolled in other universities. Almost\n40 years later, the HBCU student population has increased 1.32x and the\nstudent population in other universities has increased 1.94x.",
caption = "Consider donating to HBCUs to help fund financial assistance programs at thehbcufoundation.org/donate\nData from data.world/nces/hbcu-fall-enrollment-1976-2015\nRecreate this graphic at nsgrantham.com/hbcu-enrollment",
x = NULL,
y = NULL
) +
guides(color = FALSE) +
dark_theme_minimal(base_family = "Inter-Light", base_size = 18) +
theme(
plot.title = element_markdown(family = "Inter-Medium", size = 18, margin = margin(0, 0, 0.9, 0, unit = "line")),
plot.title.position = "plot",
plot.subtitle = element_text(size = 15, lineheight = 1.1, margin = margin(0, 0, 1.2, 0, unit = "line")),
plot.caption = element_text(size = 10, lineheight = 1.1),
plot.caption.position = "plot",
plot.margin = margin(1, 2, 1, 1, unit = "line"),
plot.background = element_rect(color = "#282a36", fill = "#282a36"),
panel.grid.major.x = element_line(color = "#44475a", size = 0.3),
panel.grid.major.y = element_line(color = "#44475a", size = 0.3),
panel.grid.minor.x = element_blank(),
panel.grid.minor.y = element_blank(),
axis.text.x = element_text(margin = margin(0, 0, 1, 0, unit = "line"))
)
ggsave("hbcu-enrollment.png", width = 8, height = 8)