
California Senate Bill 277 eliminated the “personal belief” exemption from vaccinations on July 1, 2016. What effect has this had on vaccination rates among California kindergarteners?
To address this question, we will use data collected by The Wall Street Journal on vaccination rates which appeared in an article What’s the Measles Vaccination Rate at Your Child’s School?
library(tidyverse)
library(patchwork)
library(ggtext)  # remotes::install_github("wilkelab/ggtext")
library(waffle)  # remotes::install_github("hrbrmstr/waffle")

vax <- read_csv('https://raw.githubusercontent.com/rfordatascience/tidytuesday/master/data/2020/2020-02-25/measles.csv')

vax
# A tibble: 66,113 x 16
   index state  year   name             type  city  county  district enroll   mmr overall xrel   xmed  xper   lat   lng
   <dbl> <chr>  <chr>  <chr>            <chr> <chr> <chr>   <lgl>     <dbl> <dbl>   <dbl> <lgl> <dbl> <dbl> <dbl> <dbl>
 1     1 Arizo… 2018-… A J Mitchell El… Publ… Noga… Santa … NA           51   100      -1 NA    NA    NA     31.3 -111.
 2     2 Arizo… 2018-… Academy Del Sol  Char… Tucs… Pima    NA           22   100      -1 NA    NA    NA     32.2 -111.
 3     3 Arizo… 2018-… Academy Del Sol… Char… Tucs… Pima    NA           85   100      -1 NA    NA    NA     32.1 -111.
 4     4 Arizo… 2018-… Academy Of Math… Char… Phoe… Marico… NA           60   100      -1 NA    NA    NA     33.5 -112.
 5     5 Arizo… 2018-… Acclaim Academy  Char… Phoe… Marico… NA           43   100      -1 NA     2.33  2.33  33.5 -112.
 6     6 Arizo… 2018-… Alfred F Garcia  Publ… Phoe… Marico… NA           36   100      -1 NA    NA    NA     33.4 -112.
 7     7 Arizo… 2018-… All Aboard Char… Char… Phoe… Marico… NA           24   100      -1 NA    NA     4.17  33.5 -112.
 8     8 Arizo… 2018-… Amerischools Ac… Char… Yuma  Yuma    NA           22   100      -1 NA    NA    NA     32.7 -115.
 9     9 Arizo… 2018-… Arizona Cultura… Priv… Phoe… Marico… NA           26   100      -1 NA    NA    NA     33.4 -112.
10    10 Arizo… 2018-… Arizona Desert … Publ… San … Yuma    NA           78   100      -1 NA    NA    NA     32.5 -115.
# … with 66,103 more rows
If we consult the data dictionary, it appears the variable we’re most interested in is overall, as this is the overall vaccination rate at each school. You could also perform the analysis with mmr if you were interested only in vaccinations for Measles, Mumps, and Rubella (MMR).
We’ll do a few things to start off.
- Replace values of
-1withNA, because it appears they both communicate missing data. - Restrict to only schools with valid values, and also only schools within California.
- Select only the variables we’re interested in and give them slightly more informative names.
- Calculate the number of individuals who are vaccinated and unvaccinated at every school using the number of students enrolled and the vaccination rate.
- Pivot this resulting dataset into a tidy data format which makes it easier to plot.
ca_vax <- vax %>%
  mutate(overall = na_if(overall, -1), enroll = na_if(enroll, -1)) %>%
  filter(state == "California", !is.na(enroll), !is.na(overall)) %>%
  select(school = name, enrolled = enroll, percent_vaccinated = overall) %>%
  distinct() %>%
  mutate(vaccinated = floor((percent_vaccinated / 100) * enrolled), unvaccinated = enrolled - vaccinated) %>%
  pivot_longer(cols = c(unvaccinated, vaccinated), names_to = "status", values_to = "n")

ca_vax
# A tibble: 13,020 x 5
   school                        enrolled percent_vaccinated status           n
   <chr>                            <dbl>              <dbl> <chr>        <dbl>
 1 Abby Reinke Elementary             137                 96 unvaccinated     6
 2 Abby Reinke Elementary             137                 96 vaccinated     131
 3 Abraham Lincoln Elementary         135                 99 unvaccinated     2
 4 Abraham Lincoln Elementary         135                 99 vaccinated     133
 5 Achieve Academy                    116                 99 unvaccinated     2
 6 Achieve Academy                    116                 99 vaccinated     114
 7 Ada Clegg Elementary               100                 97 unvaccinated     3
 8 Ada Clegg Elementary               100                 97 vaccinated      97
 9 Adam William Laird Elementary      121                 99 unvaccinated     2
10 Adam William Laird Elementary      121                 99 vaccinated     119
# … with 13,010 more rows
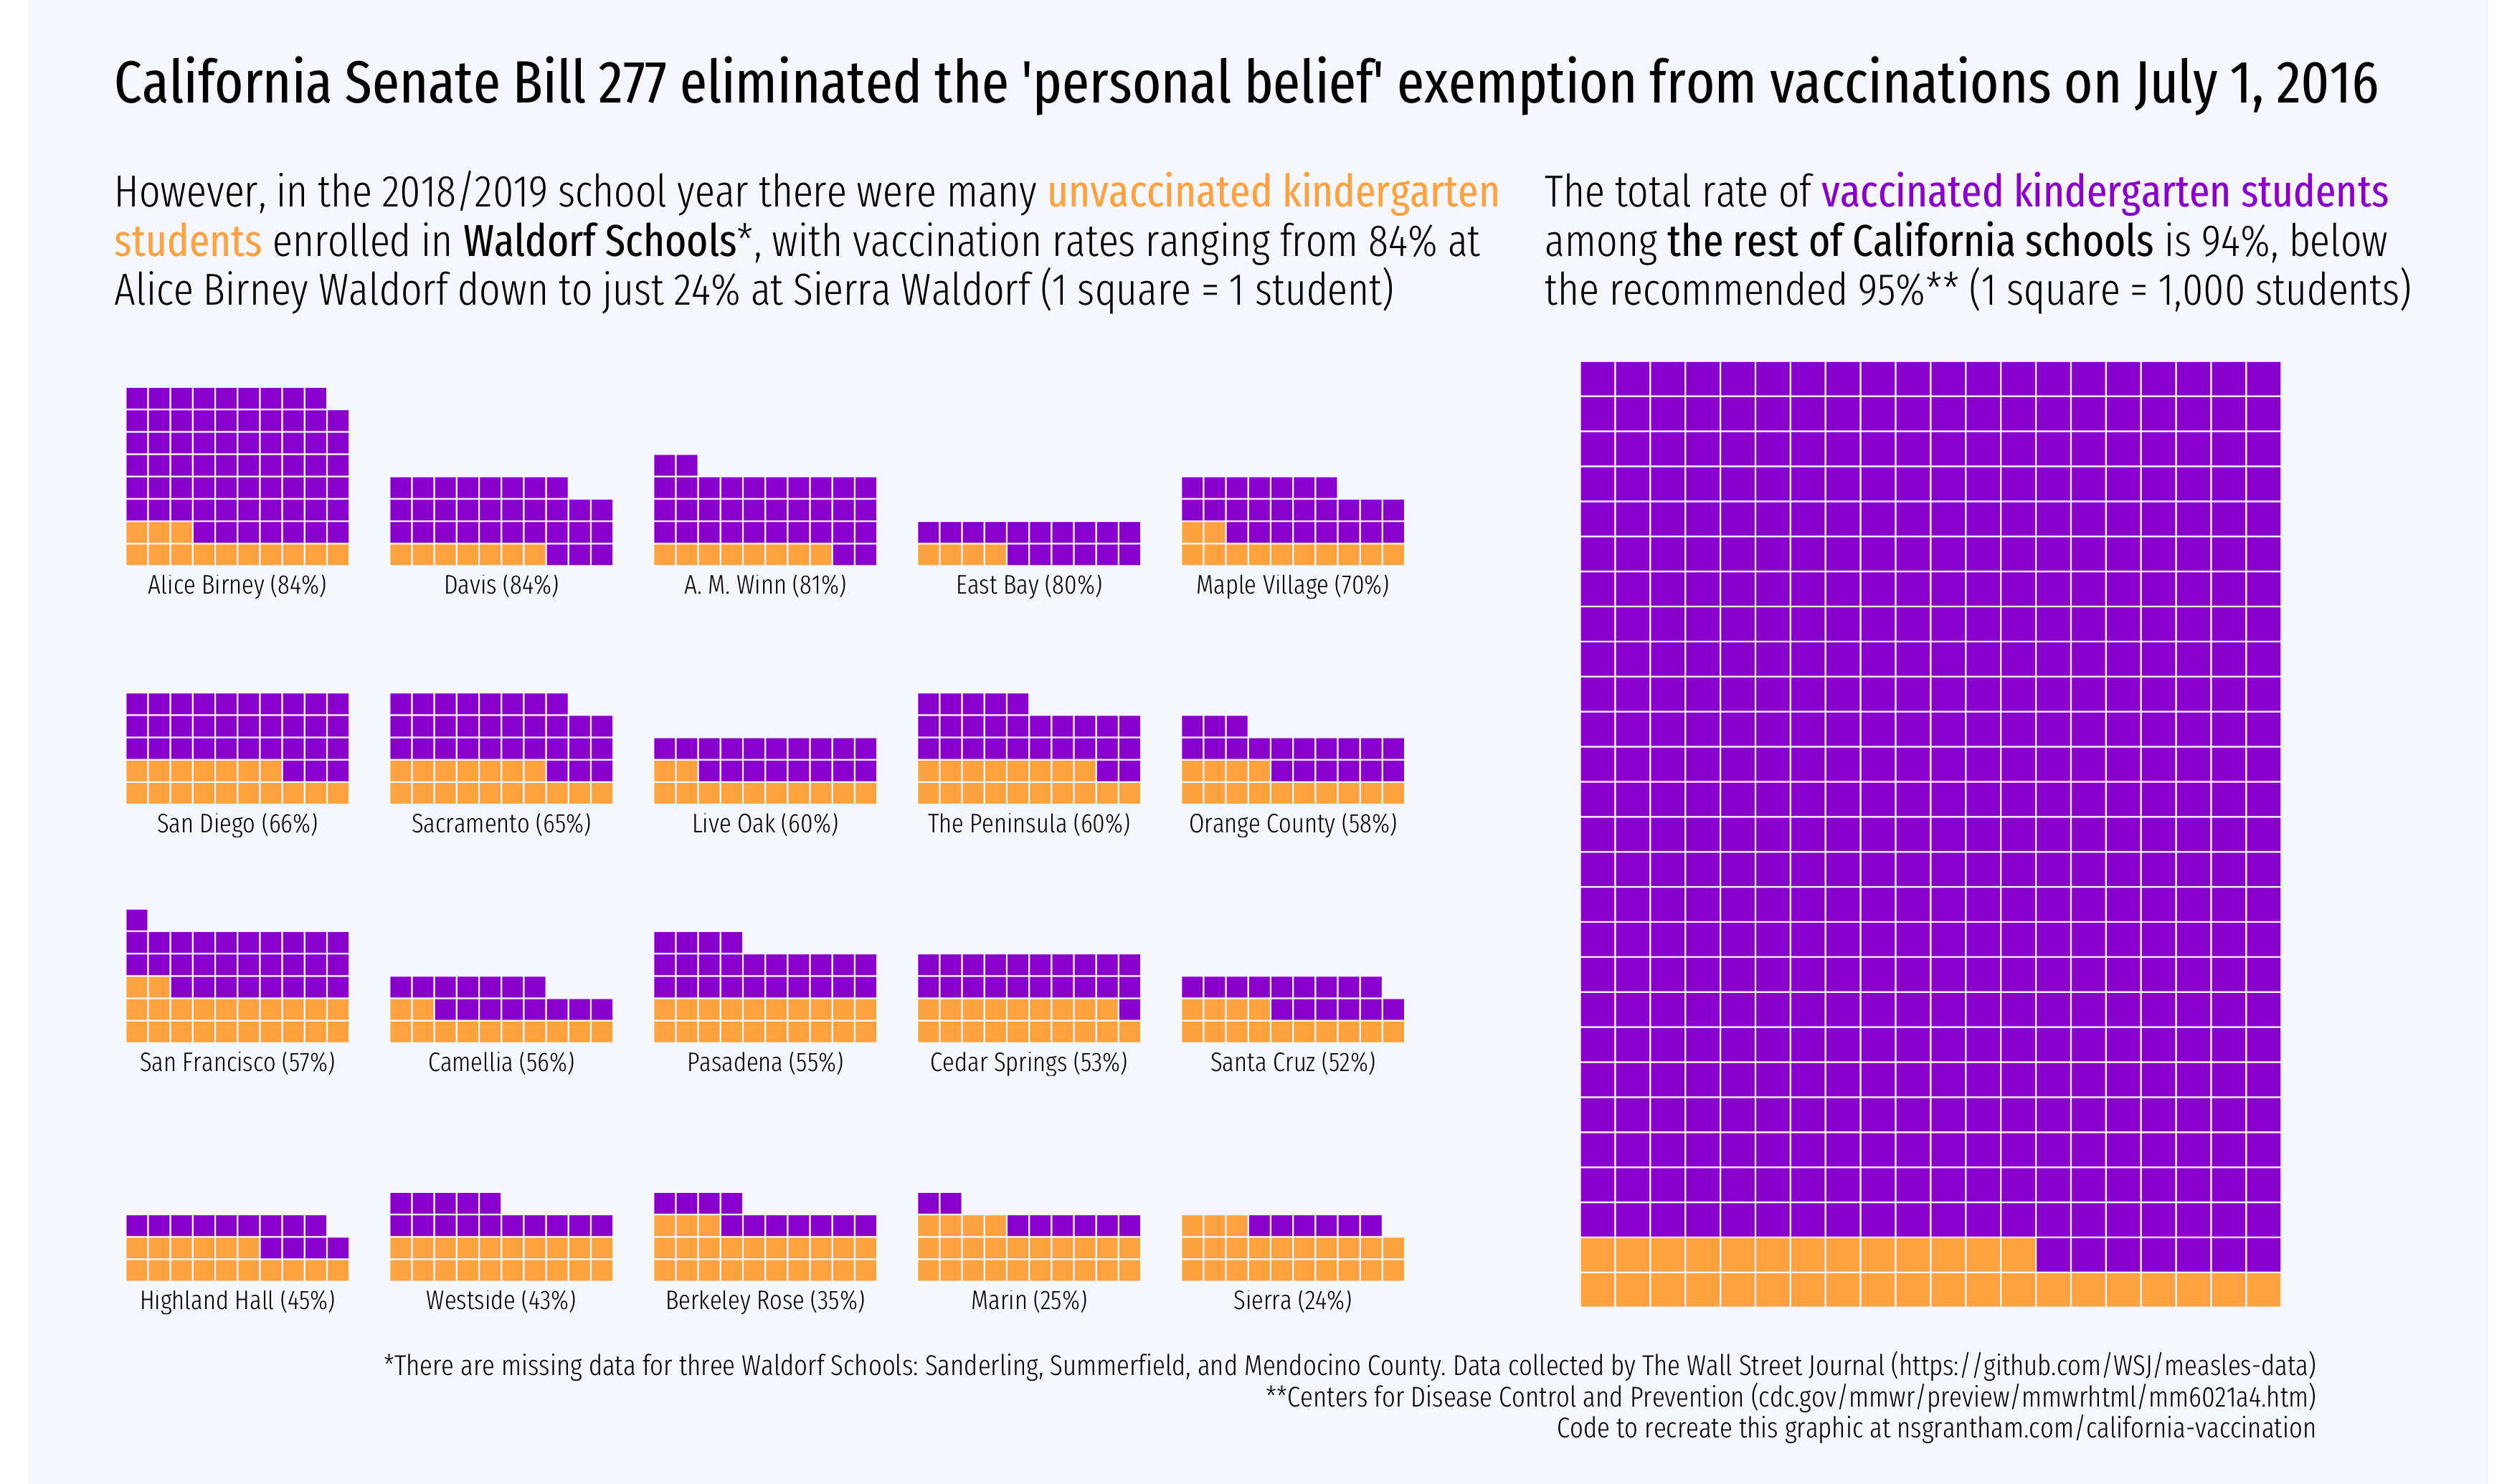
In the course of exploring this data, I found much lower rates of vaccination among Waldorf Schools. Waldorf Schools offer an alternative approach to education, one that emphasizes childhood individuality and spiritual development over more rigorous teaching methods. They also tend to private and expensive. As you might guess, the wealthy parents of children enrolled in these schools tend to be anti-vaccination. One article called out the behavior as Measles for the One Percent.
How do the vaccination rates at Waldorf Schools compare to the rest of schools in California? Did the California Senate Bill 277, which eliminated the ‘personal belief’ exemption to vaccinations on July 1, 2016, have any effect at all?
To start with, we’ll subset down to Waldorf Schools only. In the process, we’ll replace some of the longer school names with shorter ones, so that they’ll fit better in our visualization to come.
waldorf_school_recodes <- c(
  "East Bay Waldorf" = "East Bay",
  "Davis Waldorf" = "Davis",
  "A. M. Winn Waldorf-Inspired" = "A. M. Winn",
  "Camellia Waldorf" = "Camellia",
  "Live Oak Waldorf" = "Live Oak",
  "Maple Village Waldorf" = "Maple Village",
  "Alice Birney Waldorfinspired" = "Alice Birney",
  "Santa Cruz Waldorf" = "Santa Cruz",
  "Waldorf School Of Orange County" = "Orange County",
  "Highland Hall Waldorf" = "Highland Hall",
  "Sacramento Waldorf" = "Sacramento",
  "The Waldorf School Of San Diego" = "San Diego",
  "Waldorf School Of The Peninsula" = "The Peninsula",
  "Cedar Springs Waldorf" = "Cedar Springs",
  "Pasadena Waldorf" = "Pasadena",
  "Westside Waldorf" = "Westside",
  "San Francisco Waldorf" = "San Francisco",
  "Berkeley Rose Waldorf" = "Berkeley Rose",
  "Sierra Waldorf" = "Sierra",
  "Marin Waldorf" = "Marin"
)

ca_vax_waldorf <- ca_vax %>%
  filter(str_detect(school, "Waldorf")) %>%
  mutate(school = recode(school, !!! waldorf_school_recodes),
         school = glue::glue("{school} ({percent_vaccinated}%)"),
         school = fct_reorder(school, percent_vaccinated, .desc = TRUE))

ca_vax_waldorf
# A tibble: 40 x 5
   school             enrolled percent_vaccinated status           n
   <fct>                 <dbl>              <dbl> <chr>        <dbl>
 1 Alice Birney (84%)       79                 84 unvaccinated    13
 2 Alice Birney (84%)       79                 84 vaccinated      66
 3 Davis (84%)              38                 84 unvaccinated     7
 4 Davis (84%)              38                 84 vaccinated      31
 5 A. M. Winn (81%)         42                 81 unvaccinated     8
 6 A. M. Winn (81%)         42                 81 vaccinated      34
 7 Westside (43%)           35                 43 unvaccinated    20
 8 Westside (43%)           35                 43 vaccinated      15
 9 Camellia (56%)           27                 56 unvaccinated    12
10 Camellia (56%)           27                 56 vaccinated      15
# … with 30 more rows
And subset to the non-Waldorf schools and count the total number of vaccinated and unvaccinated kindergarteners.
ca_vax_nonwaldorf <- ca_vax %>%
  filter(!str_detect(school, "Waldorf")) %>%
  group_by(status) %>%
  summarize(n = sum(n)) %>%
  ungroup()
# A tibble: 2 x 2
  status            n
  <chr>         <dbl>
1 unvaccinated  33181
2 vaccinated   507065
Finally, we’ll create a waffle visualization to highlight differences in number of vaccinations at Waldorf Schools compared to the total vaccination rate across the rest of the schools in California.
unvaccinated_color <- "#FFB14E"
vaccinated_color <- "#9D02D7"

p_waldorf <- ggplot(ca_waldorf_vax, aes(values = n, fill = status)) +
  geom_waffle(color = "#F8F8FF", size = .25, n_rows = 10, flip = TRUE) +
  facet_wrap(~ school, nrow = 4, strip.position = "bottom") +
  coord_equal() +
  scale_fill_manual(values = c(unvaccinated_color, vaccinated_color)) +
  guides(fill = FALSE) +
  labs(subtitle = glue::glue("However, in the 2018/2019 school year there were many <span style='color:{unvaccinated_color}; font-family:\"Fira Sans Extra Condensed\";'>unvaccinated kindergarten<br>students</span> enrolled in <span style='font-family:\"Fira Sans Extra Condensed\"'>Waldorf Schools</span>\\*, with vaccination rates ranging from 84% at<br>Alice Birney Waldorf down to just 24% at Sierra Waldorf (1 square = 1 student)"))

p_nonwaldorf <- ggplot(ca_nonwaldorf_vax, aes(values = n / 1000, fill = status)) +
  geom_waffle(color = "#F8F8FF", size = 0.25, n_rows = 20, flip = TRUE) +
  coord_equal() +
  scale_fill_manual(values =c(unvaccinated_color, vaccinated_color)) +
  guides(fill = FALSE) +
  labs(subtitle = glue::glue("The total rate of <span style='color:{vaccinated_color}; font-family:\"Fira Sans Extra Condensed\";'>vaccinated kindergarten students</span><br>among <span style='font-family:\"Fira Sans Extra Condensed\"'>the rest of California schools</span> is 94%, below<br>the recommended 95%\\*\\* (1 square = 1,000 students)"))

(p_waldorf | p_nonwaldorf) +
  plot_annotation(
    title = "California Senate Bill 277 eliminated the 'personal belief' exemption from vaccinations on July 1, 2016",
    caption = "*There are missing data for three Waldorf Schools: Sanderling, Summerfield, and Mendocino County. Data collected by The Wall Street Journal (https://github.com/WSJ/measles-data)\n**Centers for Disease Control and Prevention (cdc.gov/mmwr/preview/mmwrhtml/mm6021a4.htm)\nCode to recreate this graphic at nsgrantham.com/california-vaccination"
  ) &
  theme_void(base_family = "Fira Sans Extra Condensed Light", base_size = 12) +
  theme(
    plot.title = element_markdown(family = "Fira Sans Extra Condensed", size = 20),
    plot.subtitle = element_markdown(size = 15, lineheight = 1.1),
    plot.caption = element_text(vjust = 8),
    plot.background = element_rect(color = "#F8F8FF", fill = "#F8F8FF"),
    plot.margin = margin(1, 2, 0, 1, unit = "lines"),
    strip.text = element_text(size = 9, vjust = 1)
  )

ggsave("california-vaccination.png", width = 11.7, height = 6.9)
From this visualization alone, which depicts vaccination rates in the 2018/2019 school year, it does not appear as though the California law had much of an effect. Although the law eliminated the ‘personal belief’ exemption to vaccinations, exemptions are still made for religious and medical reasons, so it may be the case that parents simply use one of these exemptions instead. Of course, a more rigorous analysis of the data would need to be conducted to truly arrive at this conclusion, the visualization here is only a starting point!